- November 21, 2015
- in Green Tips
- by marcos
- 592
- 0

The yearly cycle of Earth’s ecosystem is simply beautiful.
As the seasons change throughout a year, the density of plant growth on land and in oceans fluctuates. NASA scientists recently imaged that yearly cycle in a stunning new animation.
The animation does not showcase a specific year of the annual plant life cycle, rather it shows an average yearly cycle based on an accumulation of satellite data and images, including data sets of the average over years and a “running average” over a certain number of days.
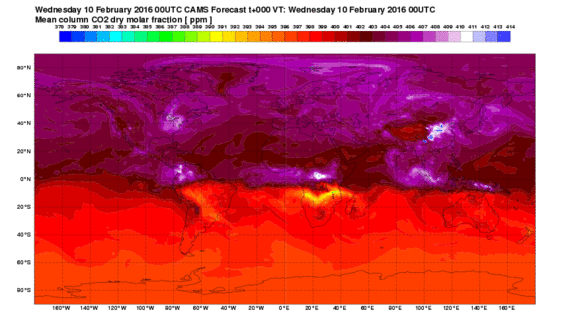
The scientists hope to use the data to better understand how our planet’s oceans and plant life absorb carbon dioxide emissions — after all, they take in about half of the carbon that humans emit, according to a video (above) that the space agency released on Nov. 12.
“The land and the ocean are really doing us a big favor,” Lesley Ott, an atmospheric scientist in the Global Modeling and Assimilation Office at NASA’s Goddard Space Flight Center in Greenbelt, Maryland, said in a statement. “Otherwise you would have carbon building up in the atmosphere twice as fast as it does now.”
Also on HuffPost:
— This feed and its contents are the property of The Huffington Post, and use is subject to our terms. It may be used for personal consumption, but may not be distributed on a website.


